Baltimore has a vacancy problem. Since the 1960s, the population has steadily declined from nearly 1 Million to just a bit more than 600,000. Neighboring Baltimore County, which surrounds the city on 3 sides, has fared much better.
The reasons people give for this include the decline of the steel mills, drugs, high taxes, and so on. I don’t particularly care what caused it all, but I am interested in what these people left behind. Baltimore city has done a pretty good job of publishing city records openly and online, and all of what I’ve used here can be found on their open data portal.
I began by gathering city records for vacant and empty properties. These records are organized by city block and lot index numbers and are conveniently labeled with GPS coordinates for plotting on a map. I cross referenced this against the geospatial mapping files (shape files) for each land parcel in town, and plotted. The results were unsurprising, as many city residents will recognize the hot spots in the northeast and west sides of the city:

Looking more closely at the tables, I began to cluster properties together based on which city block they belonged to. There are several thousand, some with no vacancies and some with many. These are the top ten, with one clear winner:
| Block | Vacants | Neighborhood |
| 1587 | 75 | MIDDLE EAST |
| 275 | 64 | CARROLLTON RIDGE |
| 119 | 63 | MIDTOWN-EDMONDSON |
| 1553 | 63 | MIDDLE EAST |
| 118 | 62 | MIDTOWN-EDMONDSON |
| 1463 | 61 | BROADWAY EAST |
| 1477 | 61 | BROADWAY EAST |
| 4616 | 59 | CENTRAL PARK HEIGHTS |
| 1591 | 58 | MILTON-MONTFORD |
The 900 block of North Castle street is the loneliest block in all of Baltimore.
More than 75 homes lay completely empty here. Nearby, in the Broadway East area, the story is much the same. In the southwest part of the city, Carrollton Ridge takes second place, with one block containing 64 completely empty homes. In total, the city lists more than 16,000 properties as vacant, many of which are either city owned or in tax arrears.
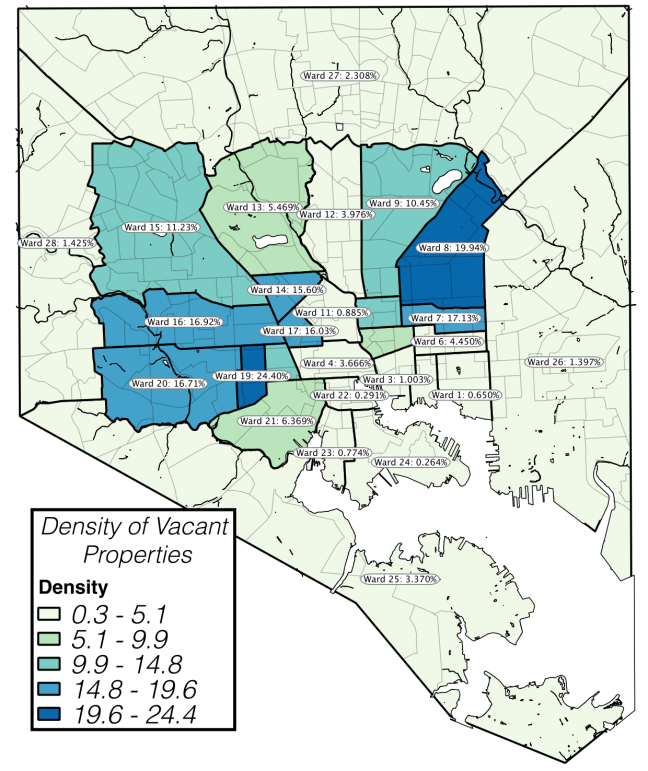
I wanted to get a better sense of the proportion of all properties that were vacant throughout the city because up to this point everything was strictly counts. I pulled out the real property rolls as of 2013 and linked them with my table of vacancies. I wasn’t quite able to tease out occupancy rates for each neighborhood, but I did manage to break things down by census ward.
Just shy of 7% of all property in the city is listed as vacant.
There are 28 wards in Baltimore. Below is a map of each one. The color corresponds to vacancies as a proportion of the total number of properties. This accounts for the variation in how populous these areas are, and gives you a better sense of the concentration of people:
Interestingly, the majority of Baltimore’s wards fall below the 7% average. This is because a small slice of city blocks in town contribute hugely to the pie.
The top 10% worst blocks in Baltimore account for more than 68% of all vacant homes city wide:
While that’s not a pretty statistic for the people living there, I find it encouraging because it means this city isn’t all bad. In fact, it’s nearly all good, and with a little luck maybe getting better.


